
- Where it is
- Home
- Dashboard
- Who can open it
- Administrators onlyAn employee account cannot open this screen at all.
- Tabs
- Overview
- Advisor
- Sales & Products
- Operations & Stock
- Price Changes
- What it writes
- Nothing on its own. Its cards hand off to the screen that owns the write — Inventory for a reorder, current orders for a stuck order, the Cash Registry for a bill.
- One exception: an occasion offer you send marks that occasion Offer sent for this year, and Change status sets it by hand
The filters scope everything — except one strip
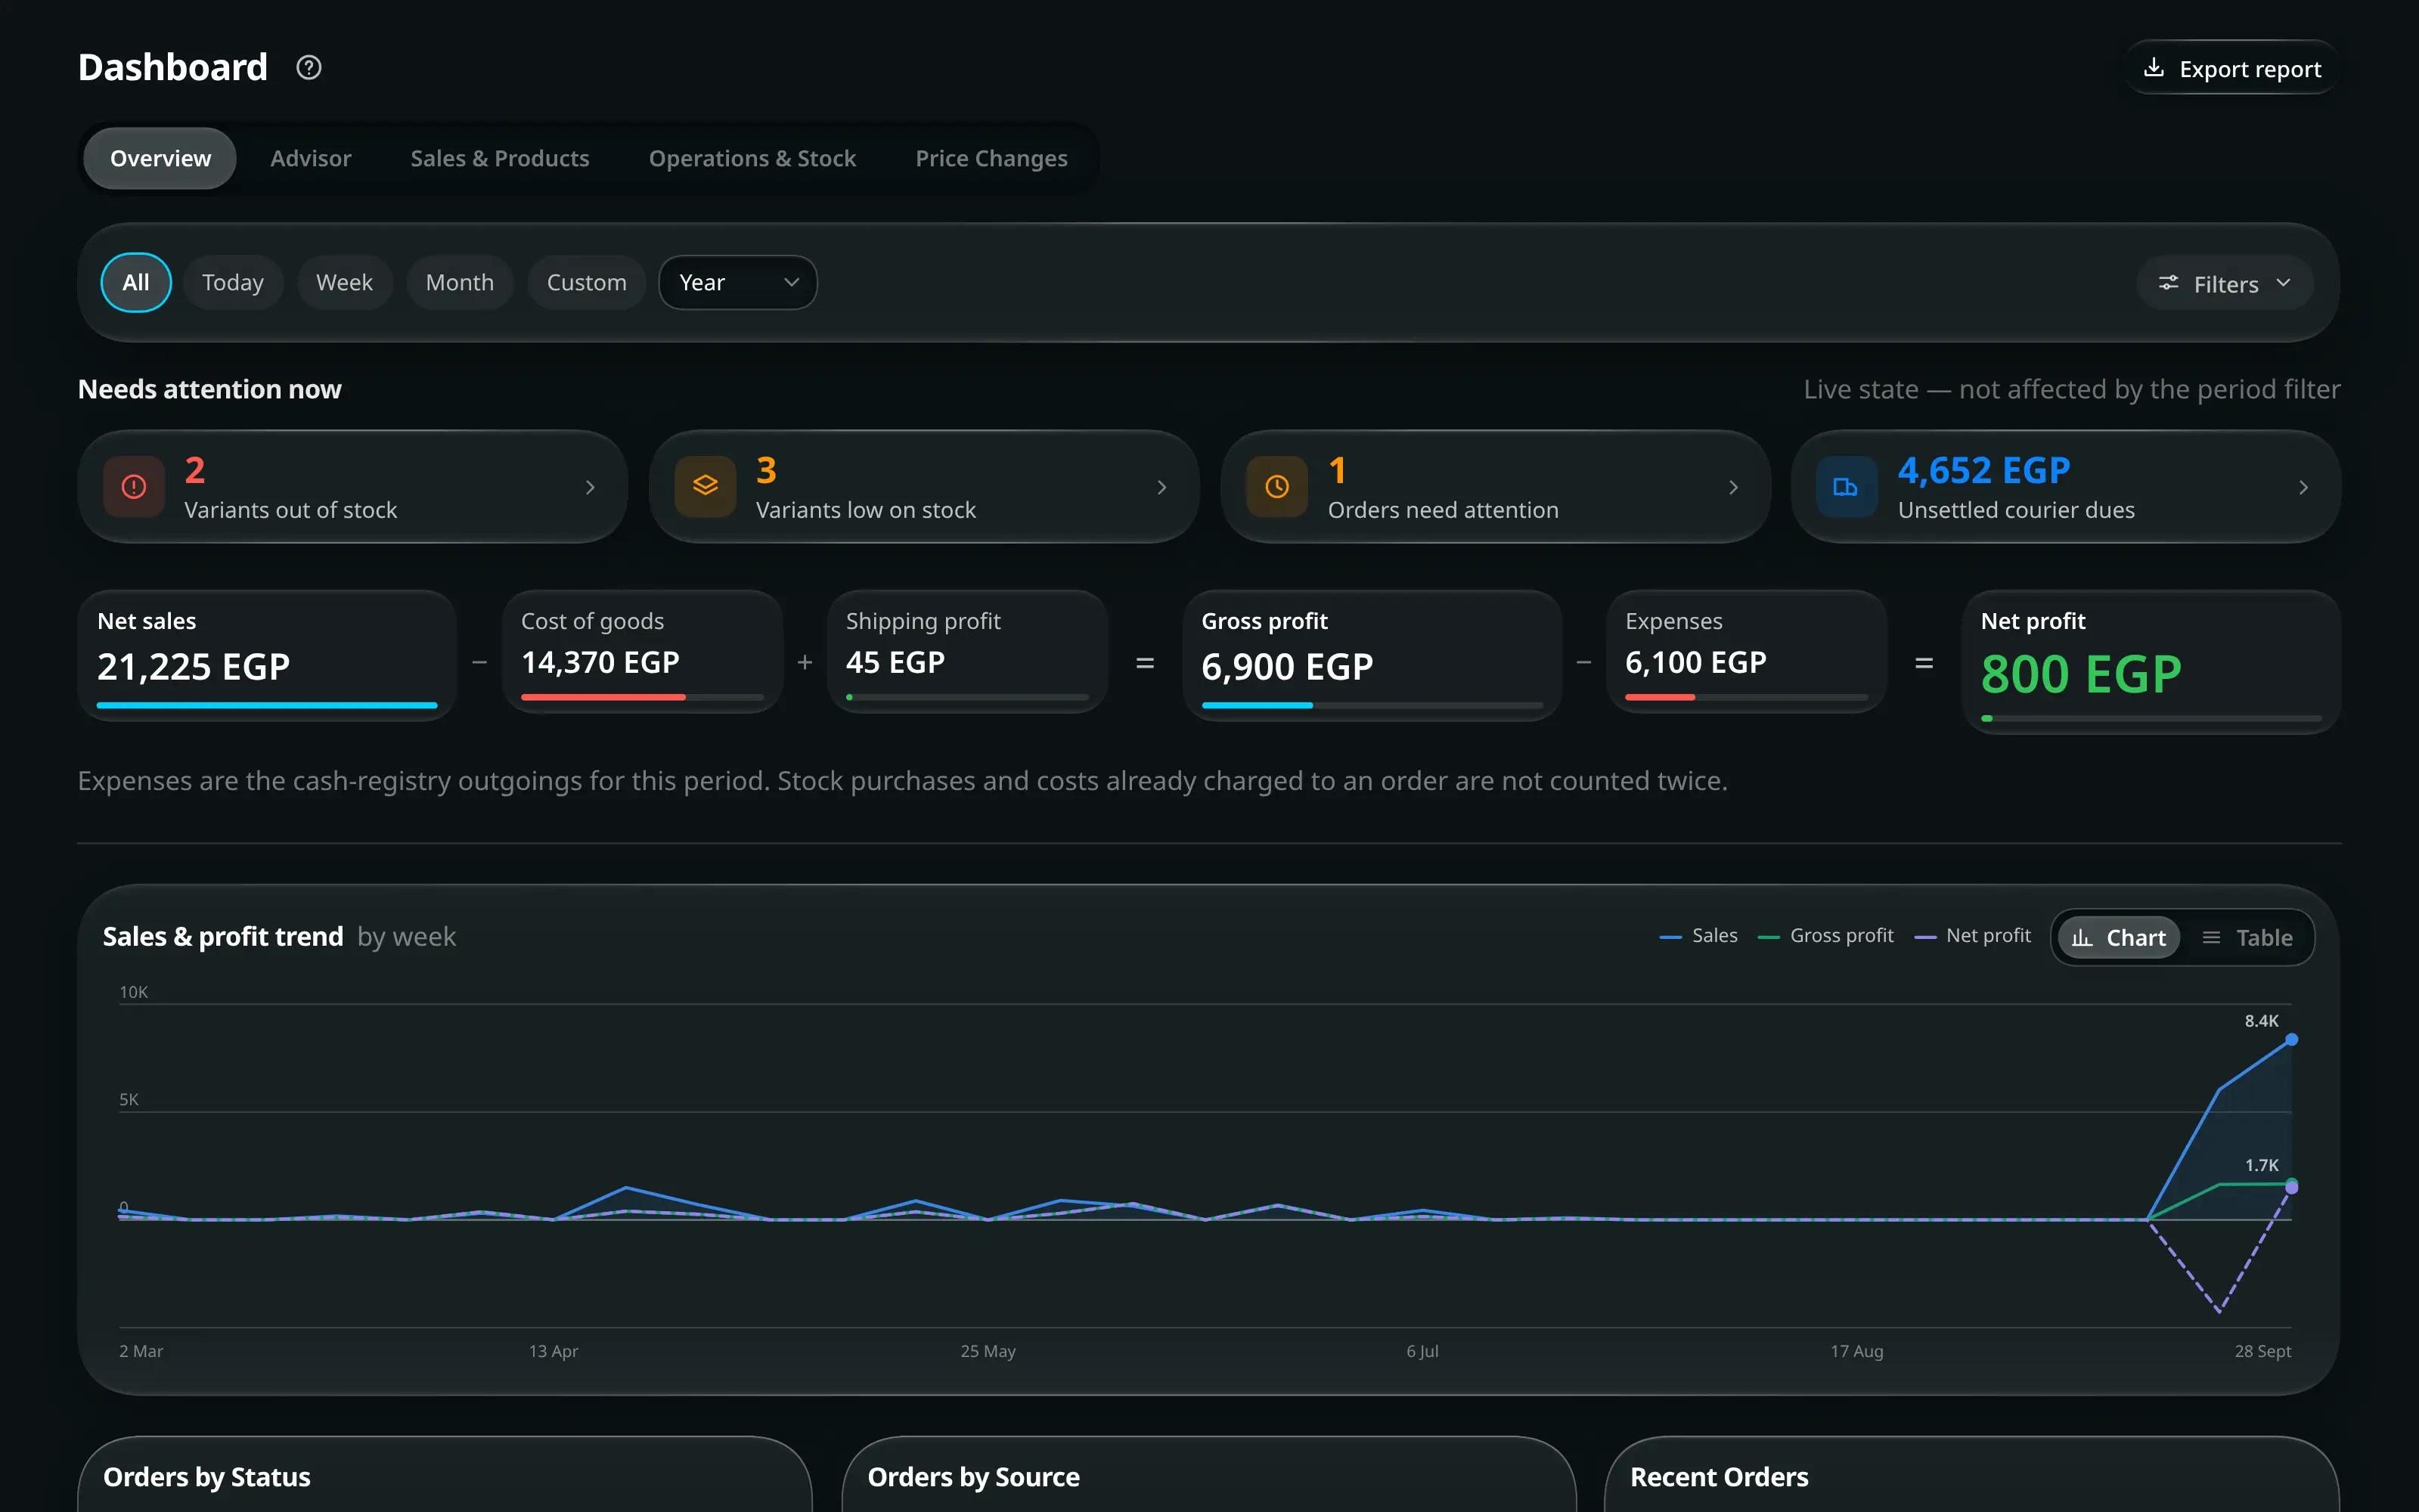
Numbered on the screenshot
- 1The five views. Every view but the Advisor is scoped by the toolbar below; the Advisor hides it and reads the whole shop.
- 2Period, branch, settlement status and financial view. Every figure on the page follows these.
- 3The whole toolbar. Today · Week · Month · Year · Custom, plus the branch and the two money filters.
- 4Export report.
| Filter | Options |
|---|---|
| Period | Today · Week · Month · Year · Custom · All |
| Branch | One branch, or All branches |
| Settlement | All · Settled · Unsettled |
| Financial view | Total contracted value · Cash collected (liquid) · Pending receivables |
The financial view is the one worth understanding. The same orders produce three different totals depending on the question:
- Total contracted value — what the orders are worth.
- Cash collected — what has actually arrived. This is your liquidity.
- Pending receivables — what is still owed to you.
Every growth figure names its own comparison: vs. yesterday, vs. last week, vs. last month, vs. previous period. A backwards custom range is caught rather than silently returning nothing: The date range is backwards, with Swap the dates.
The attention band ignores the period
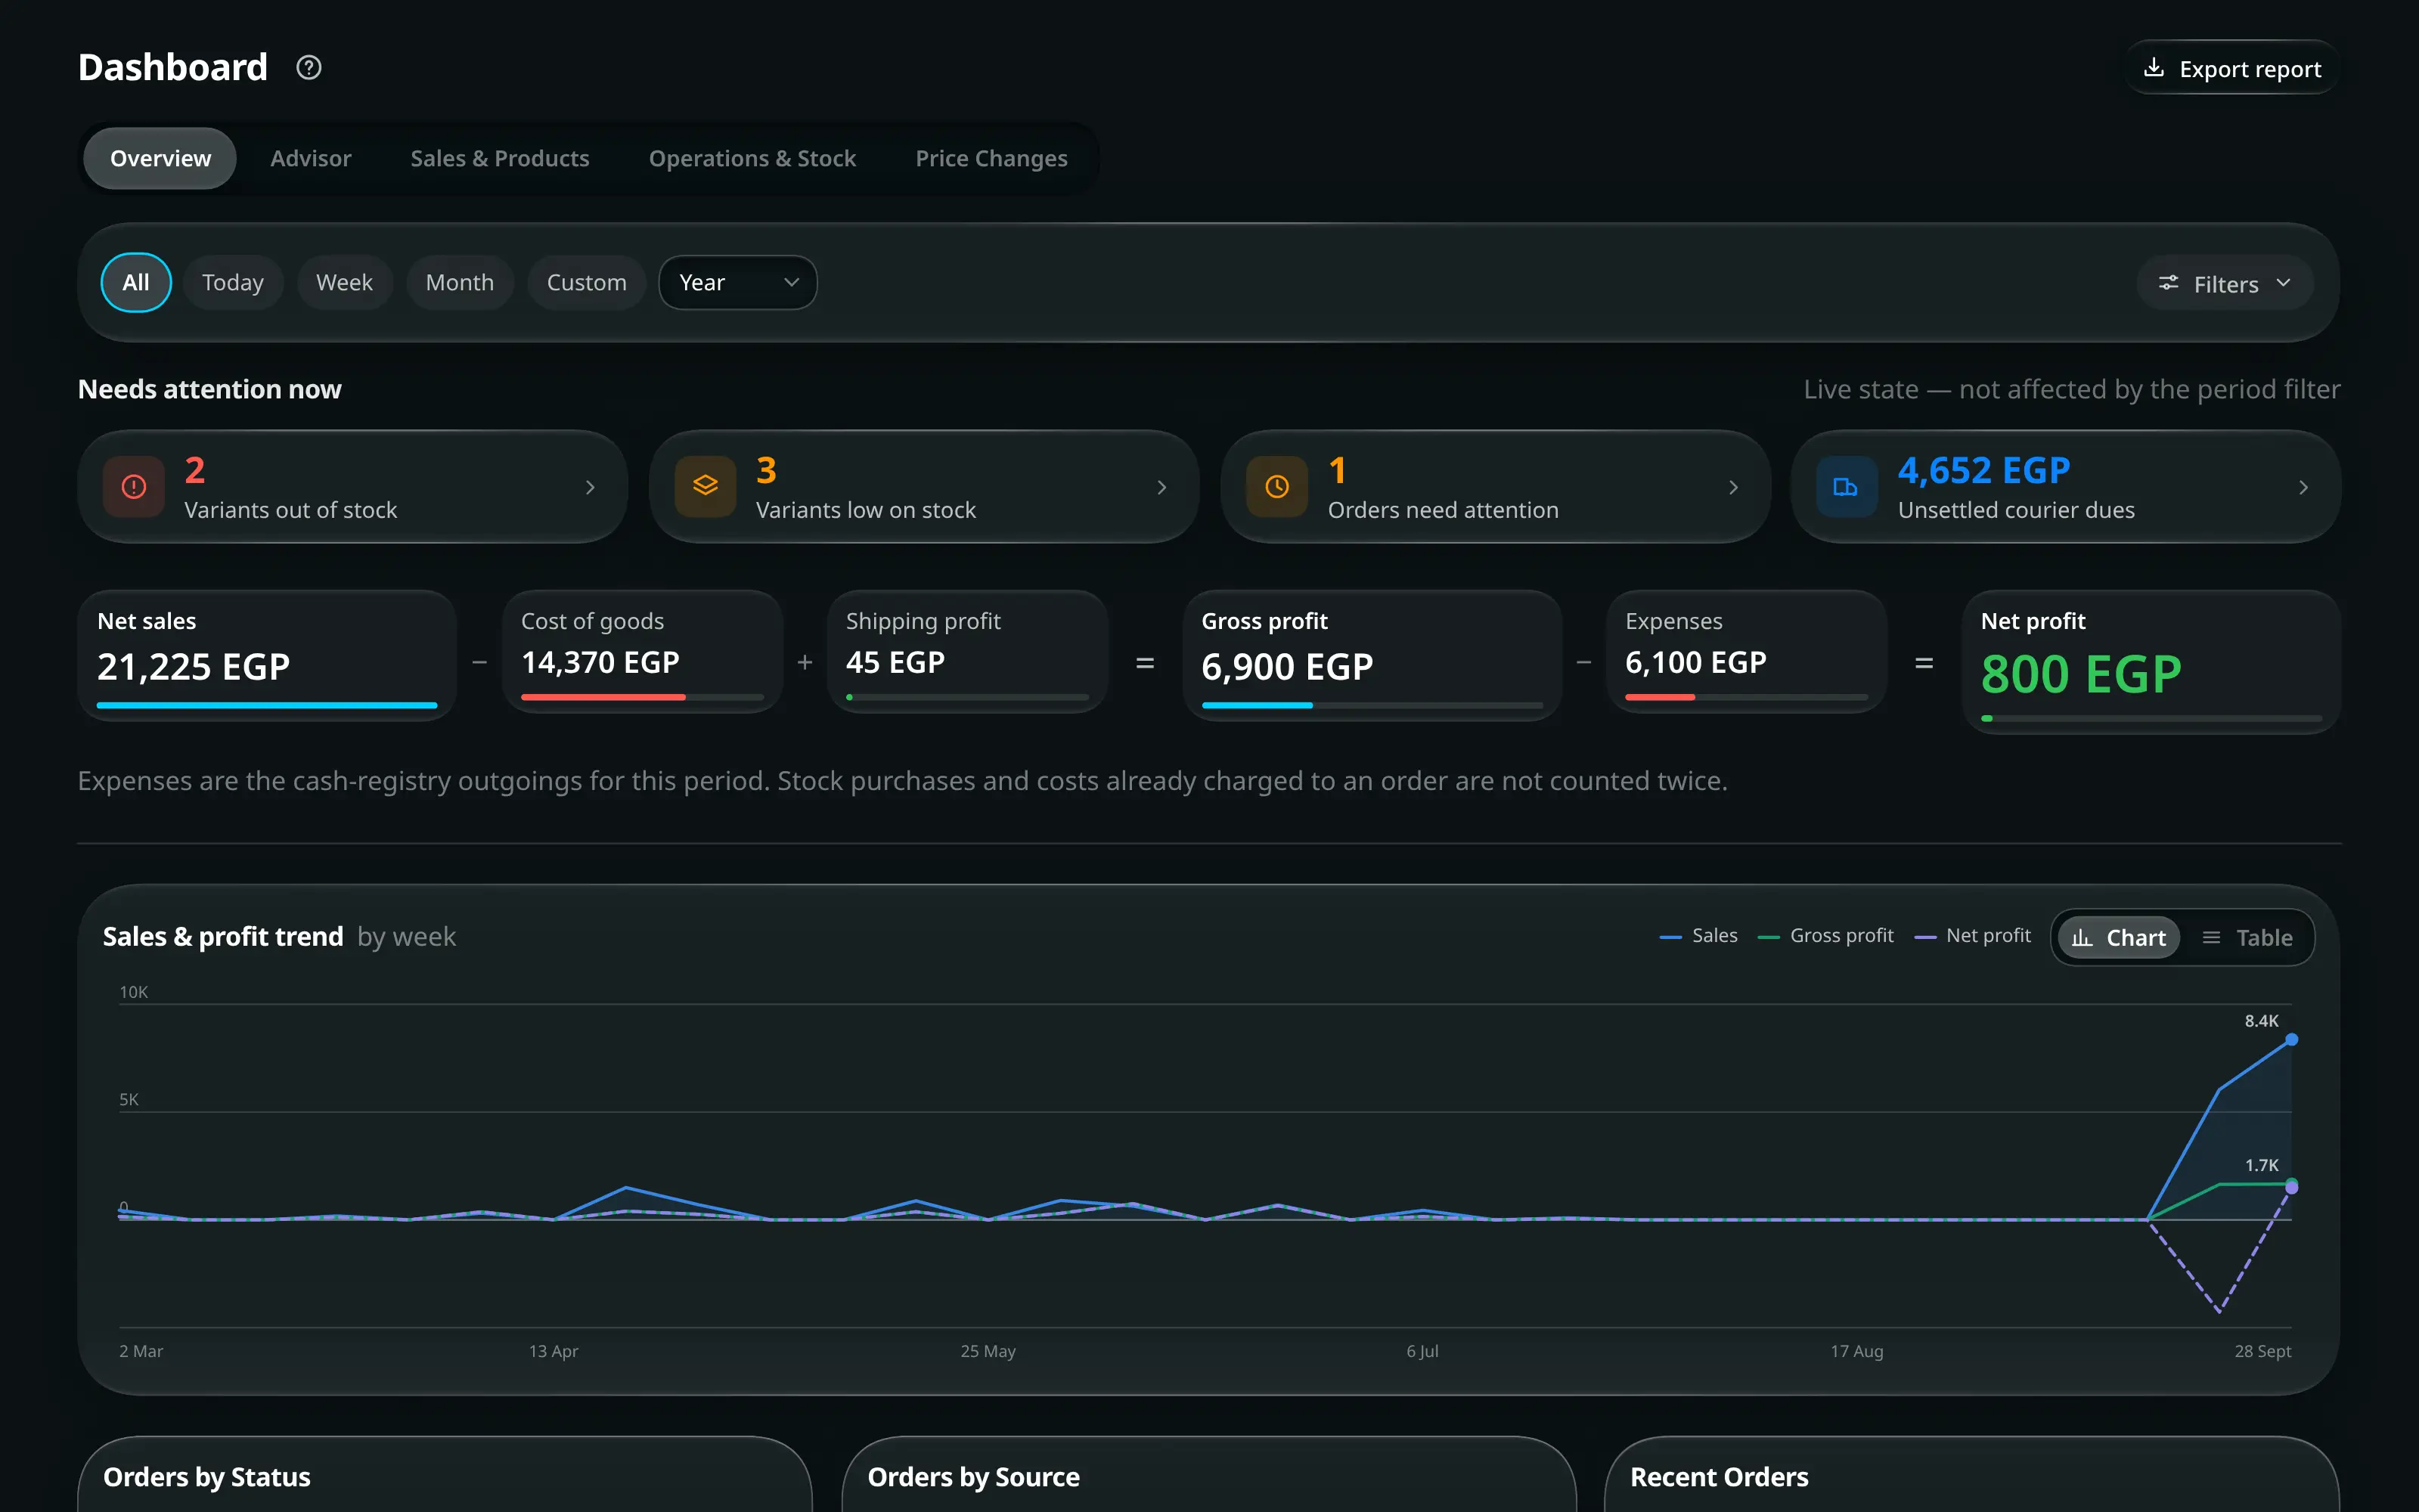
At the top sits one band, Needs attention now, with Live state — not affected by the period filter printed under it. The counts inside it are text you can press, not buttons — each one opens what it is counting:
| Count | Opens |
|---|---|
| Variants out of stock | The list of them |
| Variants low on stock | The same, above zero |
| Orders need attention | Urgent and SLA-due orders |
| Unsettled courier dues | The Operations view |
The band takes the colour of the worst thing in it — red if something is out of stock, amber if something is only low — while each count keeps its own colour beside its label.
The bottom line, read as one sentence
The Overview opens on the period’s profit and loss written out as an equation, on the page itself rather than in cards:
Net sales − Cost of goods + Shipping profit = Gross profit − Expenses = Net profit.
The three totals — net sales, gross profit and net profit — are set larger; the three movements between them are quieter. Every figure carries a hairline under it whose length is that figure’s size against the largest one in the row, and the change against the previous period beside it. The bottom line is the last and largest thing, and it is tinted green or red.
| Figure | What it is |
|---|---|
| Net sales | Sales for the period, after discounts |
| Cost of goods | What the things sold cost the shop |
| Shipping profit | Shipping charged minus what the couriers cost. The sign moves to the operator, so a subsidised shipping line reads − 200, never + −200 |
| Gross profit | What the sales left behind, before running costs |
| Expenses | The Cash Registry’s outgoings for the period |
| Net profit | The bottom line |
Every figure in the row opens the orders behind it. On a narrow screen the row folds into a ledger — one figure per line with the operator down the leading edge.
What counts as an expense
Expenses are the Cash Registry rows for the period, with three deliberate exclusions — each one would otherwise be counted twice on this same screen:
- Transfers between safes. The shop moving its own float is not money leaving it.
- Stock purchases. Stock is already counted as the goods’ cost on the day it sells.
- Costs already charged to an order — a courier fee, a workshop job. Those are inside that order’s own profit.
Pressing the tile lists every row that IS counted, with the date, the branch and the note, so the figure can be checked line by line.
Dig deeper — every other figure
At the foot of the Overview is one control, Dig deeper, with a count on it saying how many figures are behind it. Opening it gives fifteen more, in three named groups — Orders & returns, What the goods earned, Who paid, and who is buying — plus Highlights.
Each figure is a row: its name, a one-line explanation under it, its value, and the change against the previous period. Hovering gives the full sentence together with the reminder that it opens.
Each row is clickable: Click for the orders behind this number. The drill-down lists the actual orders and states the basis — which is the part that makes a dashboard trustworthy rather than decorative.
The fold stays as you left it while the screen is open, so live data arriving does not close it under you.
| KPI | Basis, in the app’s own words |
|---|---|
| Total Sales | Every order in the current filters, whatever its state |
| Net sales | Active orders only — returned and cancelled are not counted |
| Cash collected | Each order contributes the share actually collected |
| Pending | Each order contributes the share still owed |
| Standard Profit | Products and services that are not material-linked |
| Bulk Contribution | Only orders carrying a material- or bulk-linked line |
| Shipping profit | Only orders that charged or paid for shipping — charged, minus cost |
| Gross Margin | Each order’s margin is its own profit over its own total |
| Net Margin | Profit after expenses, over sales — expenses belong to the period, not to a row |
| Avg. Order Value | The period’s net sales divided by the orders in it |
| Units Sold | Every product quantity plus every service on the order |
| Discounts Given | Only orders that carried a discount appear |
| Still Owed | Only orders with money still to collect appear |
| Returned / cancelled | The orders every monthly total quietly loses |
| New Customers | Their first order ever is one of the orders in this period |
| Repeat Rate | The share of this period’s customers the shop had met before |
The five views
Six blocks, in this order: the attention band, the profit and loss equation, the sales and profit trend chart, then Orders by Status, Orders by Source and Recent Orders, and finally Dig deeper.
Only the three at the bottom are cards, and that is the rule the whole screen follows: a card is for something you can point at — a chart, a list, a picture. A number is not one, so it is set as type on the page instead.
Orders by Status and Orders by Source are the same shape: a ring beside a legend that names every slice with its count and its share of the total, so a stage worth 5% of the book is not left to be judged by eye off the ring. A slice under one per cent reads
<1%rather than rounding down to nothing.Highlights is the row of six facts inside Dig deeper — daily growth, monthly growth, best seller, top source, top branch and busiest day. Its caption names a split that is easy to miss: the two growth figures compare today with yesterday and this month with last month, so they do not follow the period filter, while the four beside them do.
The trend chart buckets itself by day, week or month depending on the period. It has a crosshair and arrow-key inspection, and a Chart Table pair in its corner — so no value is reachable only by hovering, which matters on a touch screen. It draws a third, dashed Net profit line whenever there are expenses in the period to subtract; the table lists sales, gross profit, expenses, net profit and orders for every bucket, in the same order as the legend, and the legend steps aside while it is up.
Reads the shop’s own orders, stock, customers, cash and couriers — Orders, stock, cash and customers, every time you open this page. Nothing leaves your shop — and turns them into a short, ranked to-do list. Shop health is drawn as a flower of five glass pills, one per area — Sales, Cash, Stock, Customers, Delivery — each in its own colour, the same colour as that area’s chip below. How full a pill is shows that area’s score, and the shop’s score out of 100 is written under the flower. The pills are clear glass, so each casts a soft shadow in its own colour. Tap a pill to open its area: the pill moves to the centre, stands upright and grows, the other four fade and blur behind it, the score under it becomes that area’s, and the list below narrows to that one area. Tap the pill again to see all five — or tap the space around it, or press Esc. How it works, beside Start with #1, explains what the Advisor reads. On a wide screen the flower, the advice and these buttons stay in a column at the side while the list scrolls beside them, and upcoming occasions sit next to Who to message today. Check again re-reads everything on the spot, and the line beside it says how fresh the list is — Checked just now, Checked 5 minutes ago — with what it read, and how long it took, in its tooltip.
How to use it, day to day:
- Read the headline. It names the area that needs you most and what the whole list is worth; that area’s pill is the emptiest one.
- Press Start with #1. The cards are already in order, so it takes you to the top one and puts you on its button.
- If a card surprises you, open Why? first — it shows the figures the card was decided from.
- Press the card’s button. Most fixes happen right there, in a sheet over the Advisor that lists exactly what is wrong; a card that needs another screen opens it and reads In progress when you come back.
- When it is dealt with, press Mark as done and Done today
moves on. A card that can wait goes to More options (the
⋯button) → Remind me tomorrow instead. - Changed something on another screen? Check again — the round arrow beside Checked just now — reads the shop again at once.
The first few times, a line under the area chips says Start at the top. Each card has one button that does the fix for you. — Got it hides it. A Pro tag beside a card’s button marks a fix that comes with the Pro package.
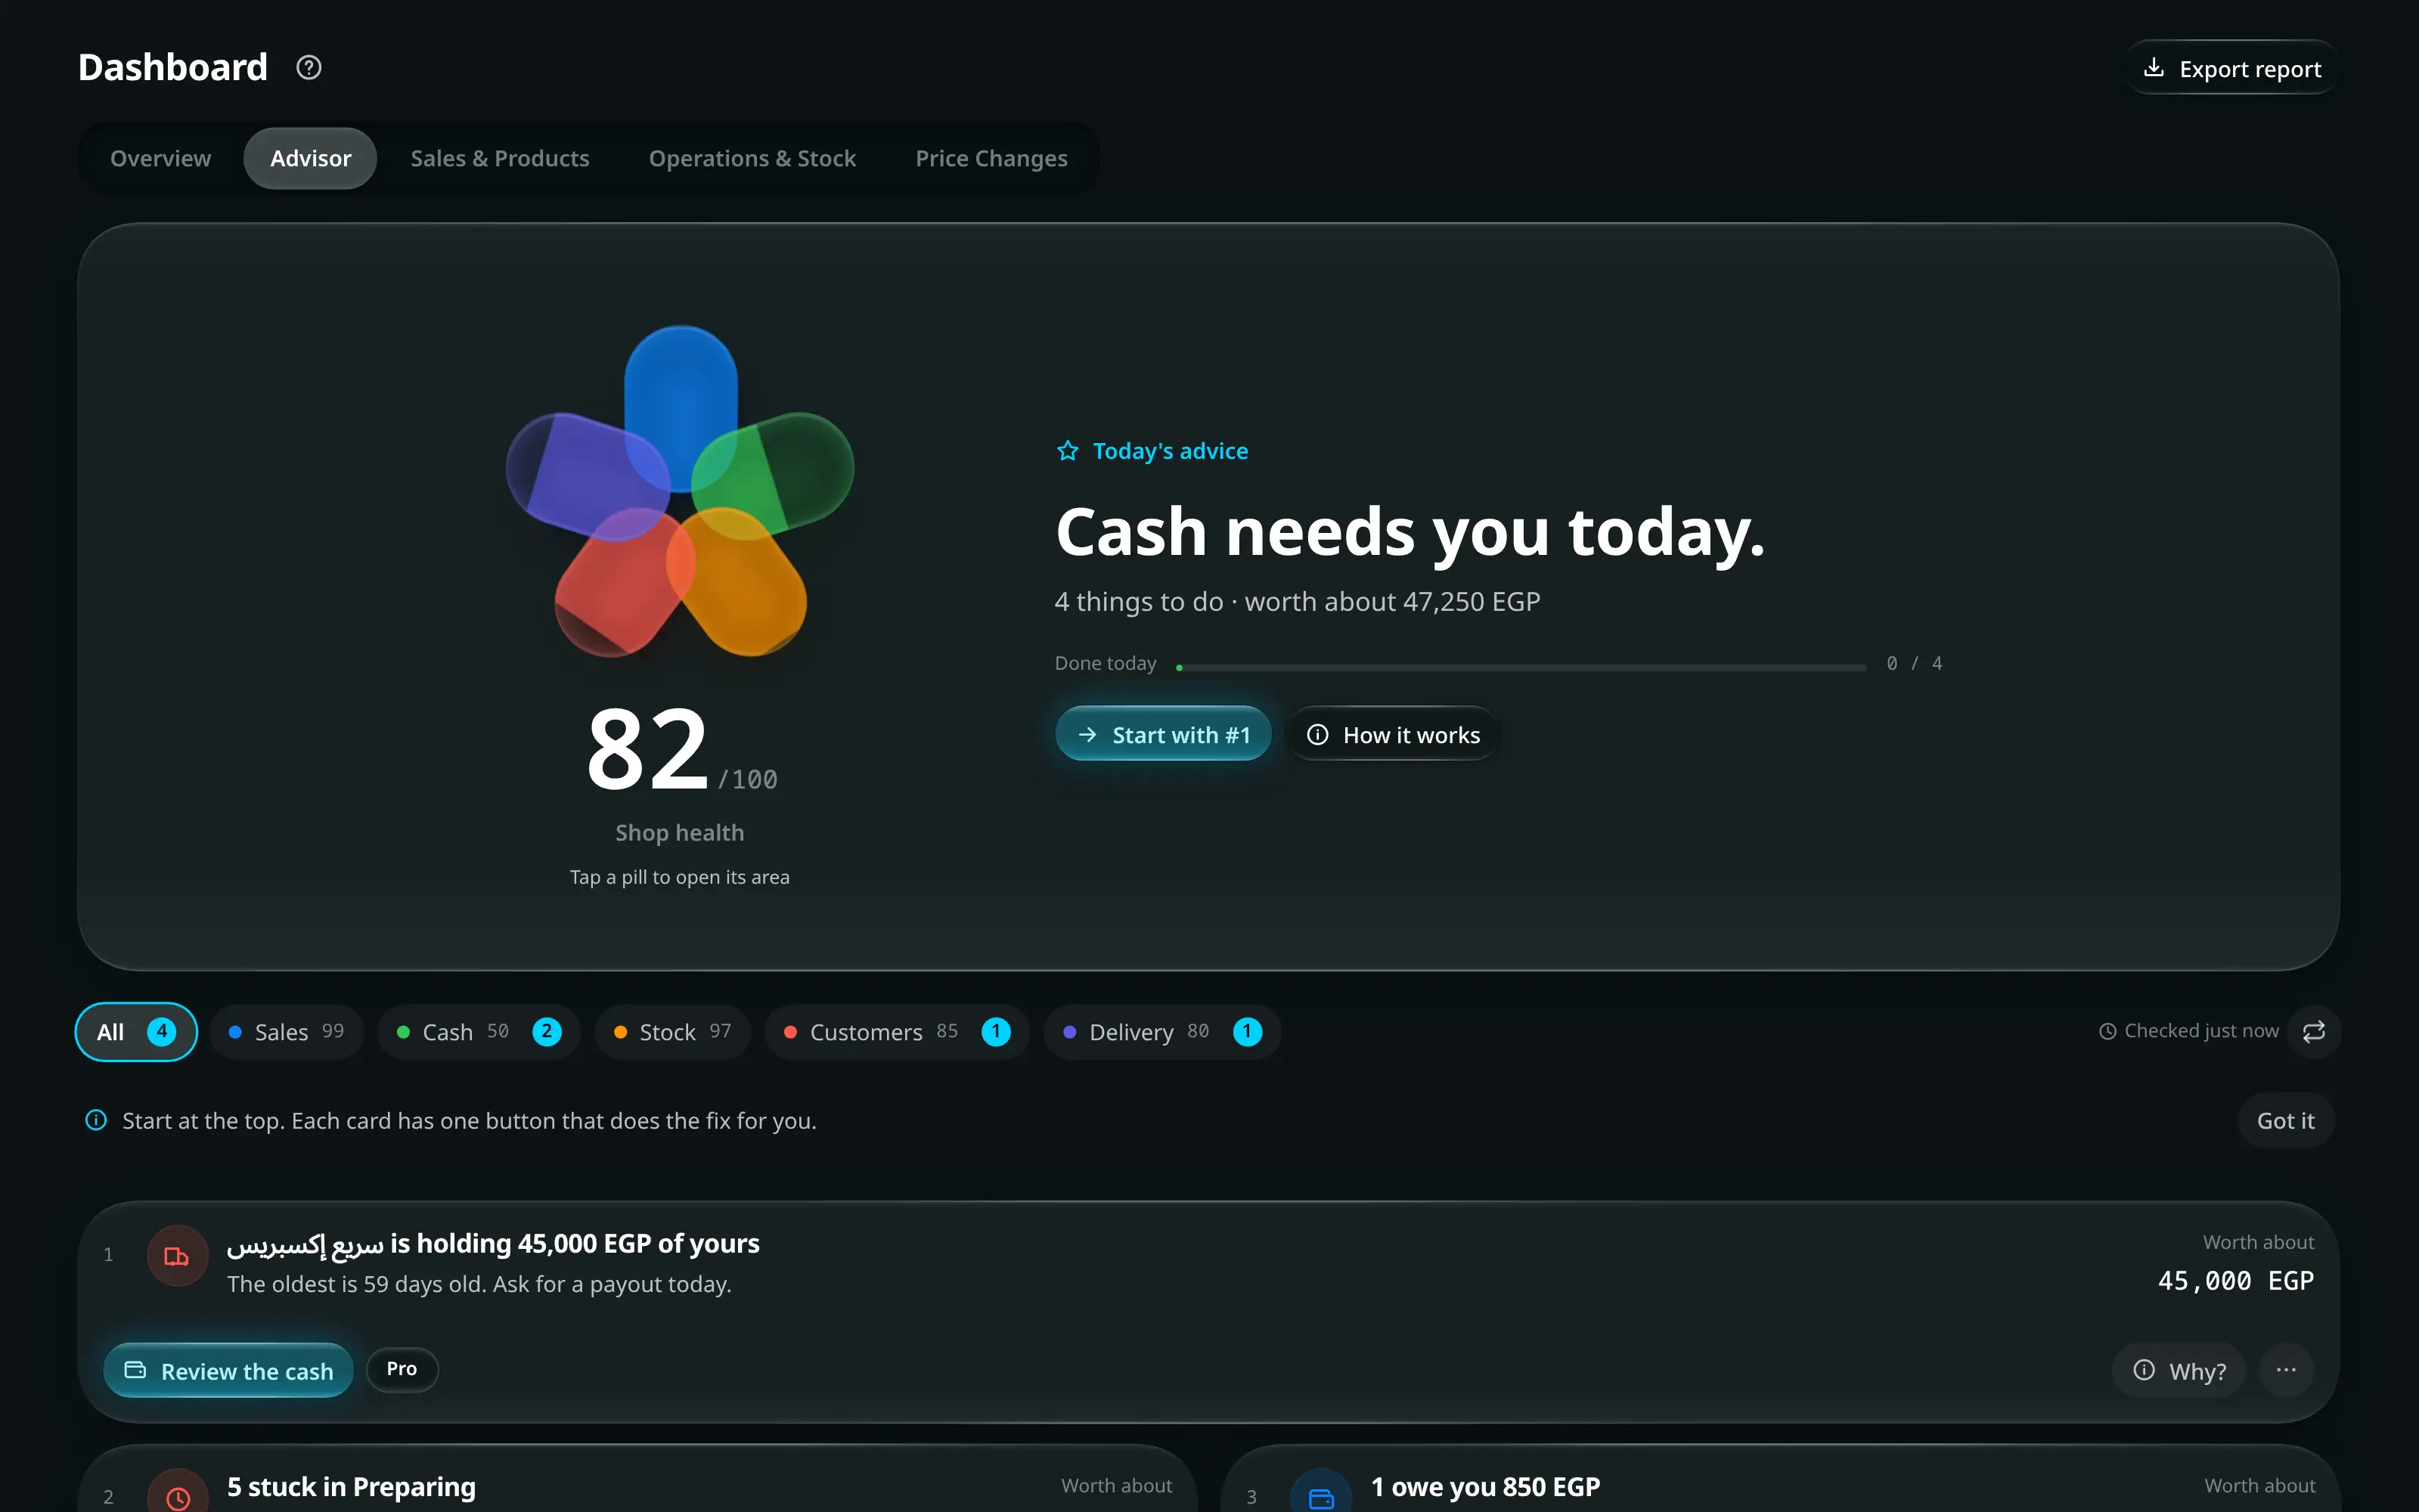
Numbered on the screenshot
- 1Shop health: one pill per area, filled to its score. Tap a pill to see only that area.
- 2How it works — what the Advisor reads, and that nothing leaves the shop.
- 3Done today. Fills as you mark cards done.
- 4Start with #1 — takes you to the top card and its button.
- 5The same five areas as chips, each with its score and how many cards it holds. All brings everything back.
- 6How fresh the list is. The round-arrow button beside it is Check again.
- 7The card’s one button. It shows what is wrong and lets you fix it in place.
- 8Why? — the figures this card was decided from.
- 9More options — Mark as done, Remind me tomorrow, Remind me next week, Not relevant.
Each card under Today’s advice states what is wrong in plain words, what it is worth about, a Why? fold with the figures it was built from, and one button that does the fix — Reorder … (with the quantity) a variant running low, Make an offer on stock that is not moving, See the orders behind heavy discounts, Fix the prices of items selling below cost, Send reminders to customers who owe money, Review them for orders stuck in one stage, See the bills for an expense jump, and Win them back for customers who have gone quiet — plus, on Pro, Review the cash a courier is holding, Review the orders whose shipping is still unpaid and See the returns where returns run high. Four more read your supply orders and your order book directly: Open the supply order when one is past its expected date, or will land after the shelf is empty at today’s pace; Suggest it to them when two items keep landing in the same order and some customers bought the first without the second; Message customers due back when the last 7 days fell well below a usual week; and Send a personal message when your best-spending regulars are later than their own rhythm.
Most buttons open a review sheet instead of sending you away. It says in one line what the card found, then lists each order, item or bill involved with the figures that made it a problem, and counts down 3 of 5 left to fix as you go — All fixed. Nice work. when nothing is left, and closing it then marks the card done. Where the fix is a number you type it right in the row: the cost of an item with none, or a new price for one selling below cost — Save or Enter, admins only. Otherwise the row’s button opens that order, product or courier on top of the sheet, and the sheet updates itself when you come back to it.
Make an offer starts a real discount on the item, not just a message. Pick 10%, 20% or 30%, or Custom: choose Discount as Percent or Amount off and type How much off. Then pick how long it runs — one week, two weeks, 30 days, or Custom with an Ends on date. The sheet shows the new price, the profit left per piece and the end date as you change them. If the item already has an offer running, it says the new one replaces it. Start the offer saves it on the item — the till and your online store both charge the discounted price until the end date — and then offers Tell past buyers: the usual message preview, addressed to the customers who bought that item before.
A Reorder … card carries a slider, Order enough to last, after it arrives — drag it and the quantity and its cost at cost price update as you go, so the button orders what the slider says.
Pressing a card’s button takes you to the fix and marks the card In progress; once it is dealt with, press Mark as done and Done today counts it. Each card’s More options menu has Mark as done, Remind me tomorrow, Remind me next week and Not relevant, and every one of those is Undo-able.
A shop still short on history sees I’m still learning your shop instead of a list, together with the setup steps that sharpen it — a variant with no cost price, a shop with no expenses recorded yet, orders saved with no phone number. That last one counts orders, not customers — an order with no phone never becomes a customer, so Show the orders lists those orders and opens the one you pick, where you add the phone. A Quick sale is left out: it is a counter sale that never asks who the customer is. Everything I checked lists every check the Advisor ran, so a clean shop reads as a visible answer rather than silence.
Your customers groups them by how they actually buy — Best, Regular, Slipping, Gone quiet, New — each with its own next step — and How soon customers come back draws the days between one visit and the same customer’s next, one bar per week: Half come back within …, and past the dashed line they count as late — blue bars came back in time, amber ones came back late. Two orders on the same day count as one visit, so a customer who orders twice in an afternoon does not read as coming back after zero days.
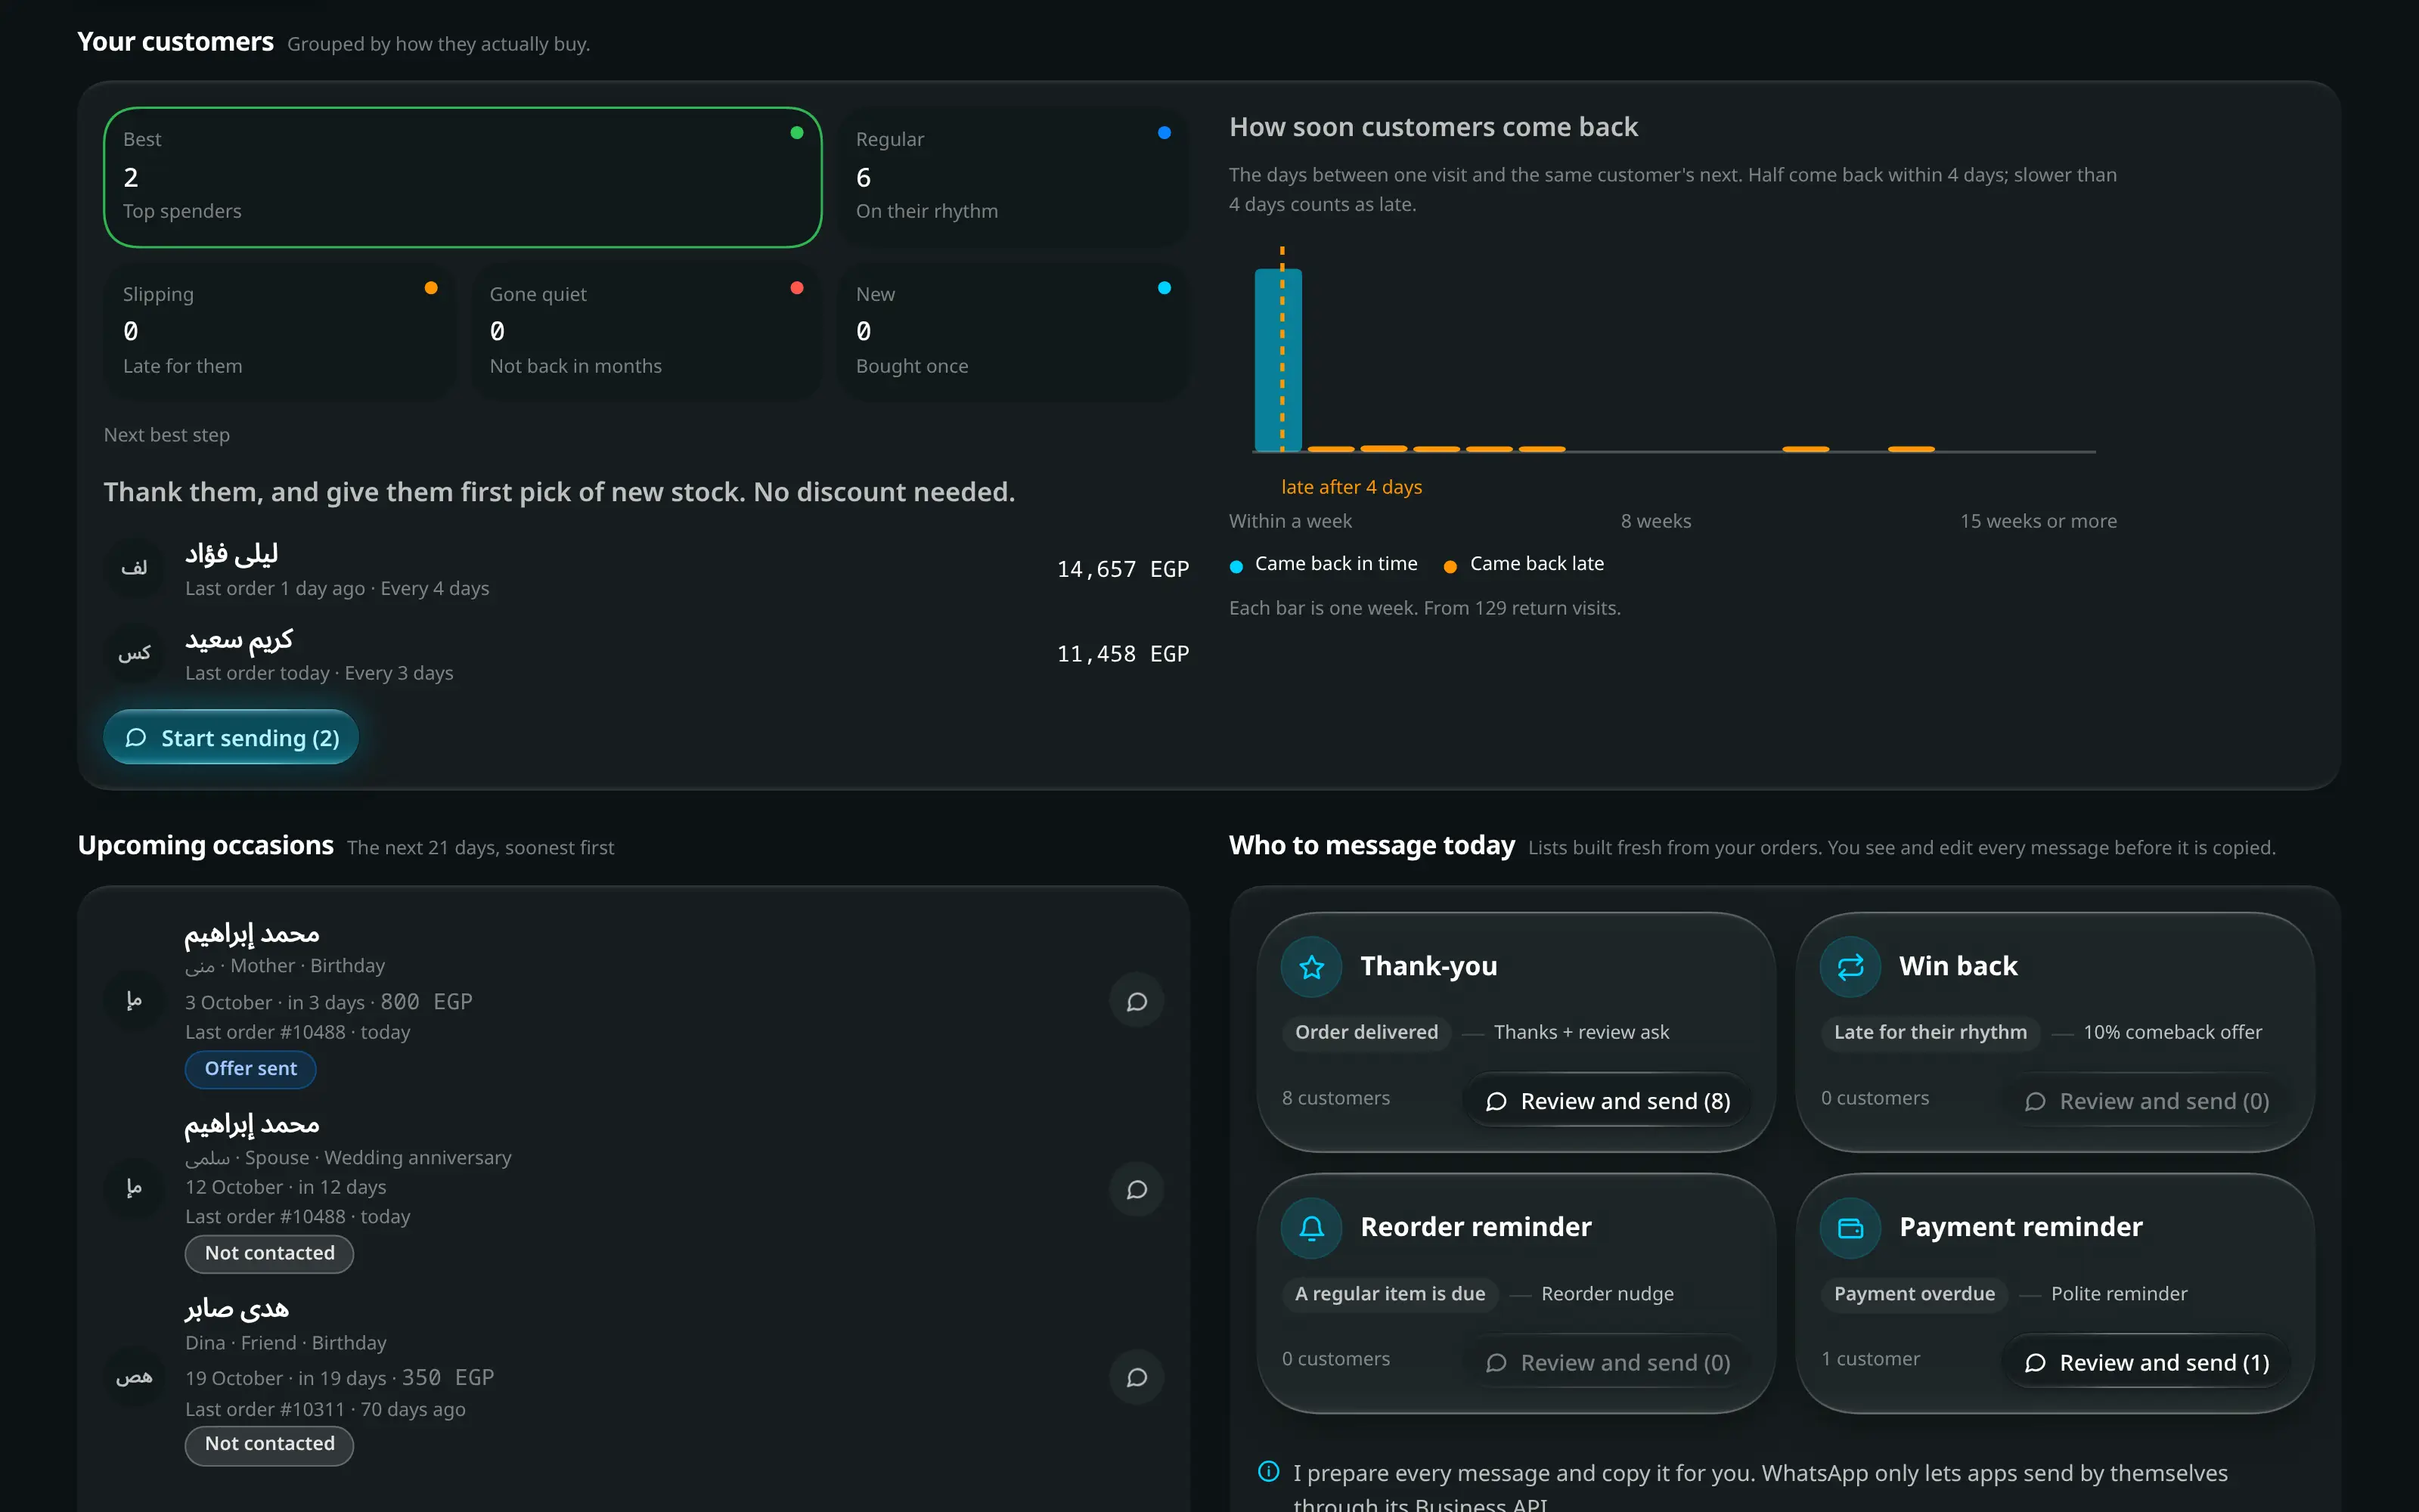
Numbered on the screenshot
- 1Your customers in five groups — Best, Regular, Slipping, Gone quiet, New — with how many are in each. Tap a group to open it.
- 2Next best step for that group, the people in it, and Start sending to message them.
- 3How soon customers come back: one bar per week between visits. Blue came back in time; amber, past the dashed line, came back late.
- 4Upcoming occasions, soonest first, with Send offer on each row (Pro, when Customer occasions is on).
When customers buy lays out your orders by weekday and hour over the last 90 days, darker where it is busier, under the busiest day and two-hour window and the quietest day, with a tip to send messages about an hour before the busy window opens. Point at a square to read it. Tap a square or a day to keep it on screen: the other days dim, and the panel beside the grid switches from The whole week to that day — its orders, its busiest hour and a bar per hour. Tap the day again, or Show the whole week, to go back. On a keyboard, walk the grid with the arrow keys, press Enter to keep a day and Escape to go back.
Who to message today turns four of those steps into lists built fresh from your orders — Thank-you, Win back, Reorder reminder, Payment reminder — each button reading Review and send (n) with how many are ready now. Nothing is sent by itself: every list opens the preview below.
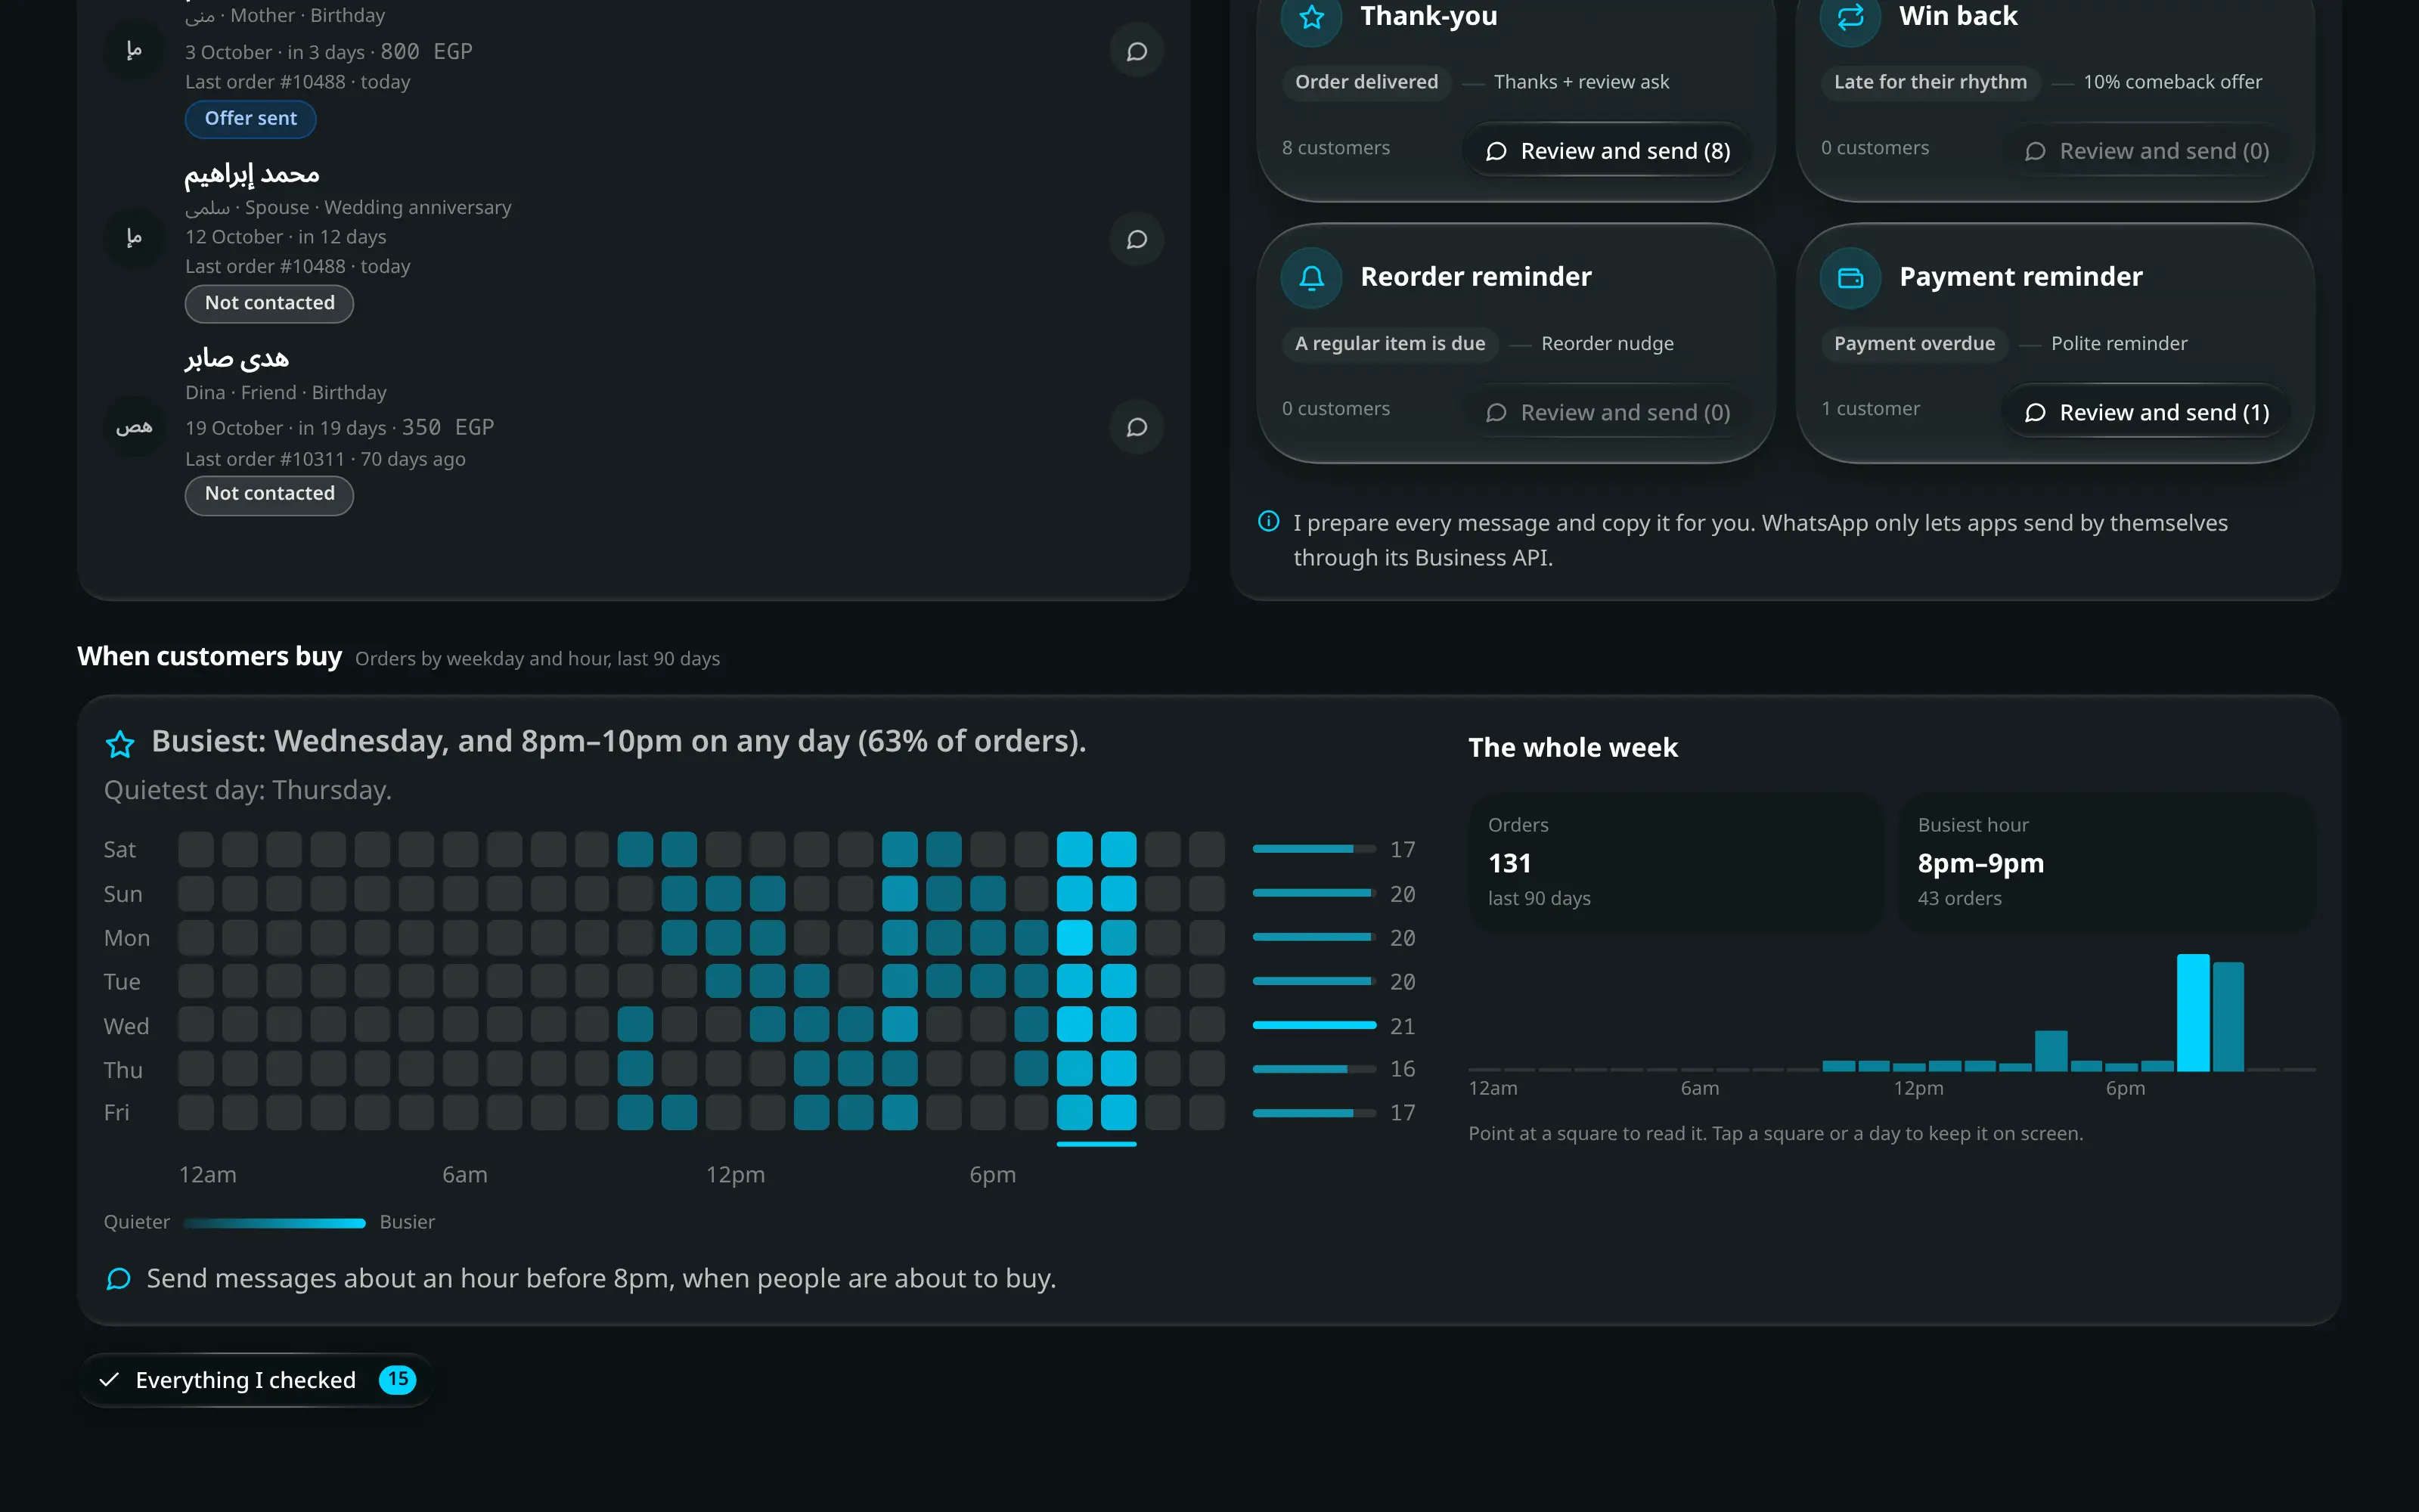
Numbered on the screenshot
- 1When customers buy — orders by weekday and hour over the last 90 days. Point at a square to read it; tap a square or a day to keep it on screen.
- 2The whole week, or the day you tapped: its orders, its busiest hour and a bar per hour.
- 3Who to message today — four lists, each button reading Review and send with how many are ready.
- 4Everything I checked — every check the Advisor ran, the clean ones included.
Sending messages, step by step:
- Tap a group under Your customers and press Start sending (n), or press Review and send (n) on one of the lists. The number is how many of them have a phone number saved.
- The send sheet opens. Change Message for everyone at the top if you want — every person’s message follows it — or edit one person’s message on its own (Use the template puts it back). Untick anyone to skip them.
- Press Send on a row. The message is copied first, then WhatsApp opens on that person: paste it and send. The row then offers Send again, and n of m sent moves on.
With Customer occasions switched on (Pro), Upcoming occasions lists the next 21 days — whose occasion, which one, how many days away, and where the outreach stands — with Send offer and Change status on each row. When some of them have not been contacted yet and a reminder is due, a card reads Occasions coming up and its button is Send occasion offers. Sending — from the card or a row — marks each occasion that went out Offer sent for this year, so it drops out of the reminders. The full list, and a longer window, are on Customers → Occasions.
Every message the Advisor offers — a reminder, a segment, an automation, an offer — opens the send sheet first: an editable template with a WhatsApp-style preview, one row per recipient to include or skip, and the exact message for that person, still editable, before anything goes out. A person with no number shows No phone number instead of a send button; with nobody to message at all the Advisor says so — No one here has a phone number saved, so there is no one to message right now — instead of offering an empty send. Sending goes through the app’s own copy-then-open WhatsApp flow, the same one used everywhere else in the app — I prepare every message and copy it for you. WhatsApp only lets apps send by themselves through its Business API — never a pre-filled link.
Sales & Products, with the period filter above it scoping every figure on the view. Four groups, each headed with the question it answers:
Group What is in it Where the money came from Sales by branch, deposits by branch, collections by method What sold Top products, bottom products, orders by weekday Who bought New vs Returning, the employee leaderboard Where they bought from Governorate analysis Nothing here is in a card: each list sits under its own heading on the page, so the four questions read in order instead of nine panels competing at the same weight.
New vs Returning gives the head-count and the money for each side, plus the repeat rate and orders per customer. The two are routinely different shapes — many new customers, most of the money from the regulars.
Governorate Analysis is a cell per governorate: the profit at the top, tinted green or red, with the sales, the order count and the shipping profit beneath it. Its caption says how it was decided — profit by delivery governorate, after the goods and the shipping.
Operations & Stock: the pipeline bar, fulfilment, courier dues and stock value. Four groups: the order pipeline, then How fulfilment is going (six figures), Money with the couriers (shipper and delivery dues), and On the bench and on the shelf (what is in production, and the inventory report). This is the view the Unsettled courier dues count jumps to. On the Basic package, which has no Couriers screen, the courier group appears only while some courier money is still owed.
Figure What it is Open Orders Everything not yet finished, with its average age In the Pipeline What those orders are still owed Needs Attention Urgent or past its promised date Avg. Fulfilment Days from order to delivery, with the median beside it On-time Rate Only orders that were given a promised date are judged Stock Value The shelf at its own average cost, and at retail The order pipeline is one bar broken into a segment per stage, so a segment’s width is that stage’s share of the whole. Under it, each stage is named in its own status colour — Being prepared, Ready / with the courier, Delivered, Returned / cancelled — with its count, its share and what it is worth. The four stages account for every order in the current filters, and the line underneath says how many that is.
Price Changes: the period at a glance, the two decision lists, and the live catalogue. This period at a glance is five figures — price changes, variants repriced, average margin now, cost pressure, and margin alerts. Margin alerts is pressable: it filters the catalogue below to the variants at risk.
What needs a decision holds two lists — Margin watch, lowest first and Biggest movers this period. Under them, Current prices is the live catalogue as a table, searchable, with per-row history and a full Change log.
The table keeps its frame because a table is an object; the figures and the two lists above it do not, for the same reason as everywhere else on this screen.
Exporting
Export report exports the current view under the current filters. What you exported is what you were looking at, which is the only way a report and a screenshot of it can be reconciled later.
When there is nothing to show
Every figure renders 0 or — rather than going blank, and a panel with no data says
No data available. A blank area means the screen is still loading.